Conversion is a general term which states the proportion of a set of users who completed a desired action, such as;
- Placing an order
- Creating an account
- Adding a product to the trolley
At Argos, the term ‘conversion’ usually refers to the first point, and tells you the number of visits which resulted in an order being placed. So when you hear ‘5% conversion’, this means that 5% of visits to the site placed an order.
In Adobe Analytics the metric ‘Conversion’ is a calculated metric, and is as below;
Conversion = [Orders: Total] / [Total Visits]
There is also the metric Conversion: Visit (De-duplicated). The calculation is as below;
Conversion: Visit (De-duplicated) = [Visits where an order was placed] / [Total Visits]
The difference between the two, as is stated in the name, is the second metric is de-duplicated. This means that if a customer places 3 orders in a visit, for example, they will only count as one visit and one order, whereas the ‘Conversion’ metric would count 3 orders against 1 visit. In this example the resulting conversion values would be;
Conversion = [Orders: Total / Visits] = [3/1] = 300% Conversion
Conversion: Visit (De-duplicated) = [Visits where an order was placed] / [Total Visits] = [1/1] = 100% Conversion
Both of these metrics are correct and can be used to report conversion, but remember that it is a generic term and means different things to different people. You should always state how you have calculated conversion for clarity.
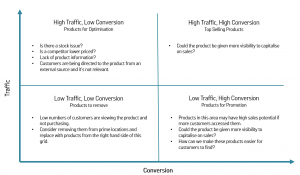
Conversion is usually reported on at a total digital or channel level, or at a product or product category level. Applying conversion to products can help you to identify which products are performing well and which aren’t, however it should always be considered in conjunction with other metrics such as traffic volumes and average order value.
Product Traffic vs Conversion Matrix
Which reports can I use Conversion metrics with?
- In the Key Metrics report for an overall view.
- Against all reports under ‘Products’ – this will tell you the conversion rate for the particular product / brand / Trading Series / Web category you are interested in.
- Against any eVar report, for example;
- Static Pages (eVar6)
- Promotion Code (eVar11)
- Search Term: Lister (eVar1)
- Search Term: Onclick (eVar4)
- Internal Campaign ID (eVar5)
This will give you the conversion rate attributed to a specific static page, promotion code or search term etc.
Conversion metrics can also be applied to different segments of customers to compare behaviour, such as;
- Customers who log in convert at x% vs y% for customers who do not.
- Visits where the Homepage banner is clicked convert at X% while visits where it is not clicked convert at Y%.
- Tablet users convert at X% while smartphone users convert at Y%.
A lot of emphasis can be placed on conversion as a key performance indicator, however it should be considered in conjunction with other metrics such as traffic volumes and average order value. Always think about why conversion has increased or decreased, and what the impact of this is. A sudden increase in conversion doesn’t always translate into better sales performance, and vice versa.
Note: Do not use Conversion with prop or traffic reports, as these are not able to stitch sales to customer interactions. They are there purely to count the volume of instances of these interactions rather than the behaviour that occurs later on.
Conversion: Weighted
Consider the below scenario;
Last week Product A had 1 visit and 1 order, resulting in 100% conversion
Last week Product B had 3,000 visits and 1,500 orders, resulting in 50% conversion.
Which product should be prioritised for optimisation?
If ranking by conversion high to low, Product A would appear at the top of the list, while Product B would be much lower down. However, only 1 customer viewed Product A whereas 3,000 customers viewed Product B and 1,500 of these chose to purchase.
Therefore, changes to Product B would potentially have a bigger revenue impact, so it should take priority over Product A.
But on a website with tens of thousands of products, how do you identify the biggest opportunities? This is where Conversion: Weighted comes in useful. As well as looking at the conversion rate of a product, it also takes into consideration the proportion of total site traffic viewing that product, meaning that as in the example above, products with lower conversion but much higher traffic will be ranked above high converting but low traffic products. The calculation is;
[Orders: Total / Visits] x [Visits / Total Visits]
If total visits was equal to 10,000, then in the example above Product A would have;
[1/1] x [1/10,000] = 0.01% Conversion: Weighted
While Product B would have;
[1,500/3,000] x [3,000/10,000] = 15% Conversion: Weighted
Therefore in a ranked report Product B would appear above Product A, and the biggest impacting products would be at the top of the list.
