Reports & Analytics Location: Content → Static Pages
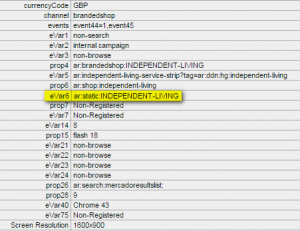
The Static Pages report attributes conversion metrics such as revenue and orders to static pages. Data is based on the eVar6 tag which can be found through a debugging tool. (Find out more about debugging here).
Metrics available in the Static Pages report;
- Conversion
- Any revenue metric (prefixed ‘Revenue:’)
- Any orders metric (prefixed ‘Orders:’)
- Any units metric (prefixed ‘Units:’)
- Average Order Value (AOV)
- Visits
Note: As this is an eVar report, it is based on a last-click wins model. This means that the last eVar6 value captured before an order is placed is credited with that order. Find out more about eVars here.
For example if you were looking at the revenue figure attributed to the Dyson shop, this value is all revenue taken when the Dyson page eVar6 tag was the last eVar6 value captured before the revenue was placed. So if a customer visited the Dyson static page and then purchased a Dyson Vacuum Cleaner and a paddling pool, the revenue from both products would be assigned to the Dyson eVar6 tag.
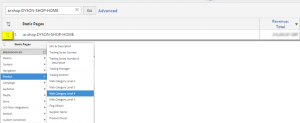
To get a better view of how the revenue figure is made up, it can be broken down by any product report. To do this, navigate to the Static Pages Report, and filter to the page you are interested in. Then click the breakdown icon and navigate to any report under ‘product’, depending on how you want to break it down.

![]()

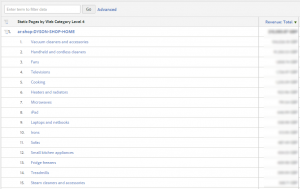
In this example, you can see that the majority of revenue attributed to the Dyson Shop came from related products (Vacuum cleaners), but revenue also came from unrelated categories such as Fans, Televisions and Cooking. You could also break down by ‘Brand’ to see how much attributed revenue was from Dyson branded products vs other brands.
This method of breakdown can be used for any of the metrics listed above.
