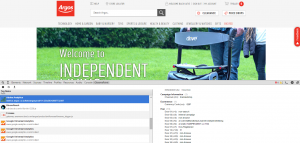
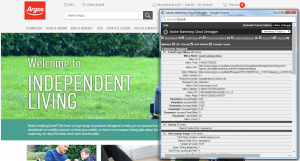
The Oxford English Dictionary defines debugging as ‘The process of identifying and removing errors from computer hardware or software’
Within analytics it’s the process of checking and validating what, when and how data is being collected by your analytics tool as users browse your site or app. It is a good idea to have a debugging tool installed on your browser so that you can find information such as the name of a page you want to do some analysis on or which campaign code was triggered when you clicked a banner.
Adobe Debugger
The Adobe Debugger is a free debugging tool, and is quick and easy to install. The instructions are available in Adobe’s help section and below;
- Copy the below text to your clipboard (highlight and Ctrl+c);
javascript:void(window.open("","dp_debugger","width=600,height=600,location=0,menubar=0,status=1,toolbar=0,resizable=1,scrollbars=1").document.write("<script language='JavaScript' id=dbg src='https://www.adobetag.com/d1/digitalpulsedebugger/live/DPD.js'></"+"script>"));
- Complete the steps appropriate for your browser:
Mozilla Firefox
- Right-click the bookmarks sidebar, then click New Bookmark.
- In the Name field, specify “Adobe Debugger” as the name for the new bookmark.
- In the Location field, paste the code that you copied to your clipboard (Ctrl + v)
- Select Load the Bookmark in the Sidebar.
- Click Add.
Google Chrome
- Right-click the Bookmarks bar then click Add Page.
- In the Name field, specify “Adobe Debugger” as the name for the new bookmark.
- In the URL field, paste the code that you copied to your clipboard earlier (Ctrl + v)
- Click Save.
Microsoft Internet Explorer
- In the Favourites Bar, click the Add to Favourites Bar icon (Image) icon.
- If the Favourites Bar is hidden, right-click the browser header, then click Favourites Bar.
- A new bookmark is created.
- Right-click the bookmark, then click Rename.
- In the New Name field, specify “Adobe Debugger” as the name, then click OK.
- Right-click the newly created bookmark again, then click Properties.
- In the URL field, paste the code that you copied to your clipboard earlier (Ctrl + v)
- Click OK.
Once installed it will appear in your bookmarks bar. Click while on the Argos desktop or mobile website to view all data that has been captured on that page.
ObservePoint TagDebugger
The ObservePoint TagDebugger is another debugging tool used by the Digital Intelligence team, which allows for more advanced debugging by showing and stacking all requests that fire on a page load (not just Adobe Analytics). It is available on Google Chrome only.
To install, go to the Chrome Web Store and search for ObservePoint TagDebugger. Follow the instructions to download and install
Note: You will need to have an up to date browser version of Chrome to install. The web store details will tell you the version you need. This debugging tool is recommended for advanced users, for general day-to-day debugging needs the Adobe debugger is perfectly fine.

