The truth is: As long as you have first-party data, you can use AI-based MTA to understand what parts of your marketing work and this will still apply post cookie-apocalypse. Standard heuristic methods — first click, last click, linear — apply set patterns to your data whereas AI methods learn patterns from your data.
In this blog we’ll crack open the bonnet of the three most popular MTA algorithms and take a deeper look at how they work in layman’s terms.
Markov Chains (Probability)

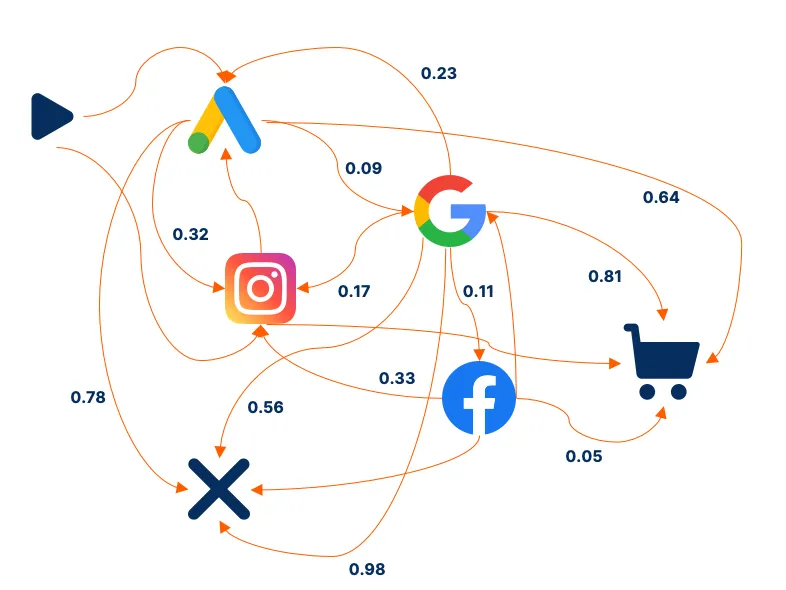
Markov Chains assign credit to different marketing channels or touchpoints based on their influence in leading to a conversion, like a purchase or a sign-up. They’re a popular concept in weather forecasting, ranking algorithms, and predictive text.
To simplify, imagine a customer’s journey as a series of steps leading to a purchase. Each step is a touchpoint — an interaction with a marketing channel such as a Google ad, a social media post, or an email campaign. The Markov Chain model views this journey as a sequence of transitions from one state (or touchpoint) to another. The goal is to determine the probability of moving from each state to the next, ultimately leading to a conversion.
Here’s how it works:
1. Transition Probability Matrix: Using source data, a transition probability matrix is created. This matrix shows the likelihood of moving from one touchpoint to another.
2. Removal Effect: The model then calculates the ‘removal effect’ by temporarily removing a touchpoint and measuring the impact on conversion rates. This helps in understanding how important each touchpoint is. If removing a touchpoint significantly lowers the conversion probability, it’s considered highly influential.
3. Attribution: Finally, the model assigns an ‘attribution score’ to each touchpoint based on its removal effect. Touchpoints that greatly reduce the likelihood of conversion when removed are given higher scores, indicating their greater importance in the conversion process.
This approach offers a more nuanced view of the customer journey compared to more traditional models like first-touch or last-touch attribution accounting for complex and interconnected nature of modern marketing landscapes, where customers often interact with multiple channels before making a decision.
Shapely Values (Game Theory)

Shapley Values, originating from cooperative game theory, offer a unique approach to Multi-Touch Attribution (MTA) in marketing analytics. This method provides a fair distribution of credit to various marketing touchpoints in a customer’s journey, ensuring each channel’s contribution towards a conversion is accurately acknowledged.
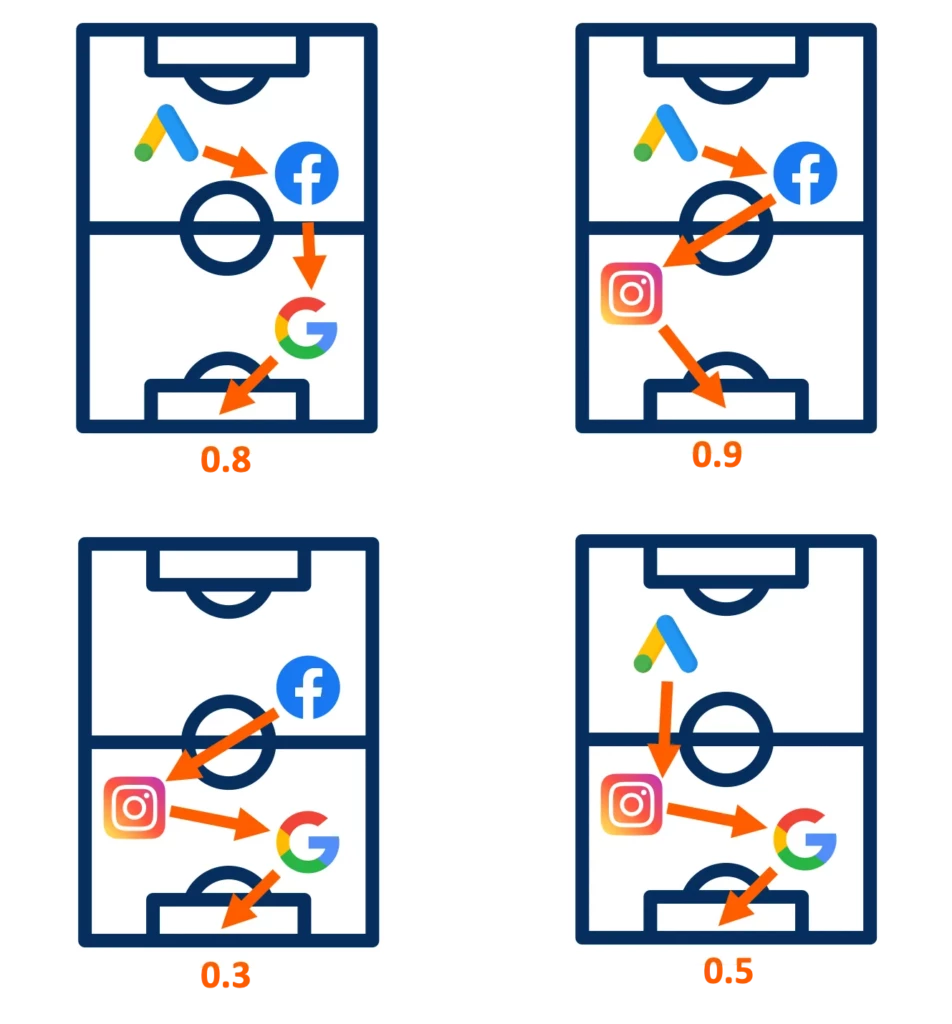
In the context of MTA, each ‘player’ is a marketing channel, and the ‘payoff’ is the conversion (like a sale or a signup). The Shapley Value formula considers all possible combinations of channels and their respective contributions to conversions.
Let’s break down how Shapley Values are applied:
1. Data Collection: The process starts with collecting detailed data on customer interactions across all marketing channels throughout their journey, leading to conversions.
2. Calculating Contributions: For each conversion, the Shapley Value method calculates the marginal contribution of each channel. It does this by considering every possible order in which the channels could appear in a customer’s journey. For example, if the journey was Email -> Social Media -> Conversion, it would consider Social Media -> Email -> Conversion as well.
3. Fair Attribution: The key aspect of Shapley Values is fairness. It averages out the contributions across all permutations, ensuring that each channel gets credit proportional to its actual impact. This means channels that are consistently helpful will be valued higher, even if they don’t directly precede a conversion.
The Shapley Value approach in MTA acknowledges the intricate and interdependent nature of marketing channels. It avoids biases inherent in other models, providing a more balanced and accurate reflection of each channel’s value in driving conversions.
Additive Hazard (Survival Analysis)

Traditionally used in medical research, Additive Hazard, a concept from Survival Analysis, provides a distinctive angle for Multi-Touch Attribution (MTA). This approach focuses on understanding the probability of a conversion event (like a sale or signup) over time via analysing the expected duration until one or more events happen
In the context of MTA, the ‘event’ is a customer’s conversion, and the analysis aims to understand how different channels influence the timing of this conversion.
Let’s delve into how Additive Hazard is applied to MTA:
1. Data Collection and Preparation: Similar to other MTA methods, it begins with collecting comprehensive data on customer interactions across all channels over time. This includes time-stamped data on when each touchpoint occurred in relation to the conversion.
2. Additive Hazard Model: This model assesses the risk (hazard) of a conversion occurring at any given time point, considering the cumulative effect of all prior marketing touchpoints. It’s ‘additive’ because it assumes that each touchpoint adds (or subtracts) a certain amount to the hazard of converting at any given time.
3. Evaluating Touchpoints Over Time: Unlike models that give credit based on the position of a touchpoint in the journey (like first or last-click), the Additive Hazard model assesses how the timing and sequence of touchpoints contribute to the likelihood of conversion. It recognizes that some channels might be more influential at the early stages of the journey, while others might play a crucial role closer to the conversion event.
In summary, an Additive Hazard approach offers a time-sensitive perspective, providing insights into how the timing and sequence of marketing touchpoints impact the likelihood of a conversion.